
This week we look at how
Market Update | Are US Equities Still Investable?
Much has been written about the valuation of the US equity market. The most obvious, objectively correct, and not particularly helpful, talking points are:
- Based on traditional valuation metrics, US equities are very expensive relative to history.
- US equities are at a record high valuation relative to the rest of the world.
- Depending on your time horizon, US equities are expensive (post 2005) or moderately cheap (post 1980s) relative to US bonds.
- Most of the time, high equity valuations mean expected long term returns are low. Most of the time, high valuations provide no insight into short to medium term returns.
We think we can add to the debate by outlining how we consider equity valuations and returns within the context of our strategic asset allocation framework. We also analyse the Tech Bubble of the 2000s, the most obvious historical precedent to today, to see if there are any asset allocation insights to be gained. Finally, we discuss the possibility that despite the current starting point, US equities outperform the rest of the world in the coming decade as they did in the last.
Capital Market Assumptions
We are currently formulating our strategic asset allocations for 2021, a process we undertake annually. In our capital market assumption framework, valuations matter for long term equity market returns, alongside other factors such as earnings growth, buybacks and dividends. There is a clear linkage between returns ten years forward and current valuations.
Since last year’s review, US equity markets have risen around 40%, compared with a 25% increase in Australia and Japan and a 20% increase in Europe. Our method of assessing valuations suggests that the US market is even more expensive relative to other regions now than last year. This can be seen in the left chart below. US equities are the most expensive market in every capital market scenario we model. Because of this, and despite some differences across other equity market return drivers, expected returns to US equities are the lowest of every region.
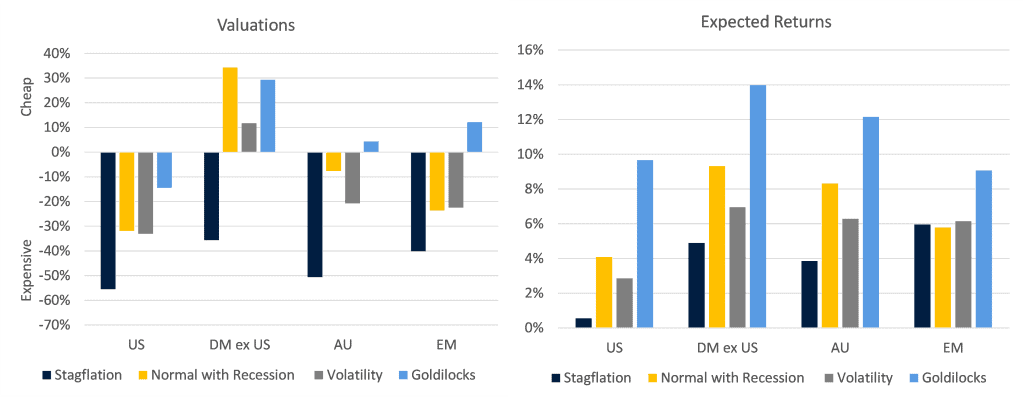
In a purely computer based (quantitative) portfolio optimization process, a strategic asset allocation under these assumptions would hold very little US equity exposure. However, it is important to frame these assumptions and outputs with the uncertainty present when making such predictions.
Five years ago, the US market was also trading at record high valuations compared to the rest of the world. However, in the subsequent five-year period, US equities returned nearly double that of the rest of the world. Computer modelling does a poor job of predicting thematic trends, such as the global dominance of US technology giants. Therefore, it is important that portfolio construction is a combination of human judgement (qualitative) and computer modelling (quantitative) processes.
The Tech Bubble Experience
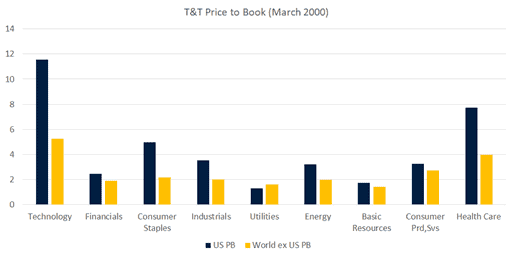
After highlighting the difficulty around trying to forecast the future, let us imagine an investor who happened to have perfect foresight as to when the 2000s Tech Bubble would pop. The perfect investor could see that broad US equity market valuations were very expensive (as they are now) in both absolute terms and relative to the rest of the world. The investor would have also known that valuation excesses were largely concentrated in the tech and health care sectors of the US (see below).
Armed with the knowledge of when the Tech Bubble would burst, an investor would surely construct a portfolio appropriate for the obvious outcome and reduce exposure to US equities overall and move away from the technology and health care sectors. Surely this portfolio would outperform over the upcoming market correction.
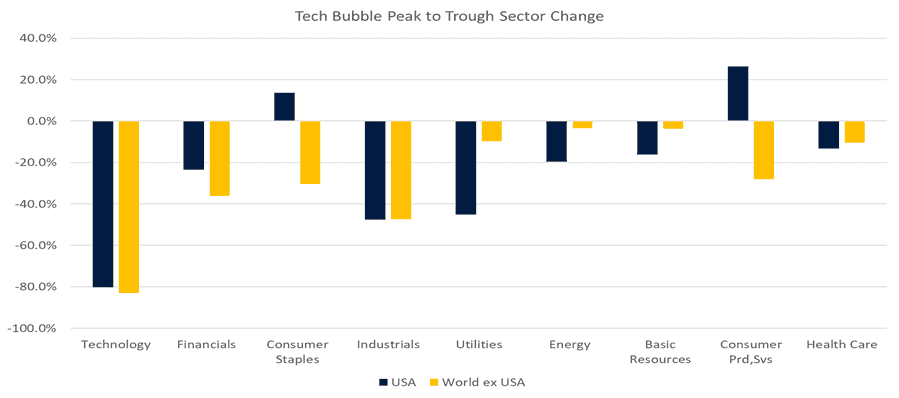
Sadly, for our fictitious investor, the overall US equity market marginally outperformed the rest of the world during the correction. At the sector level, the tech sector was hit hard, but marginally outperformed tech in the rest of the world. Health care also happened to be one of the better performing sectors during the correction.
The consumer sectors in the US also substantially outperformed their rest of world counterparts, delivering positive returns while every other sector fell.
Part of the reason the investor experienced such poor performance even though they timed the bursting of the bubble correctly is because valuations are not the only driver of markets, particularly over shorter time horizons.
The point we are trying to make in the somewhat contrived example above is that even though we know the US market is expensive relative to history and much more expensive than the rest of the world, that condition isn’t enough to cause an equity market correction or even US underperformance should a correction occur. Portfolio construction requires deeper consideration than valuations alone.
Can the US Market Continue to Outperform?
While high valuations and low expected returns don’t guarantee US underperformance, they do tilt the deck towards that outcome, particularly as time horizons extend. So, what would it take for the US to continue to outperform and dominate the rest of the world?
As we have mentioned in previous Market Insights[1], the current dominance of US tech companies is different to the Tech Bubble. These companies have a track record of delivering above market earnings due to a combination of first mover advantage, monopoly power, network effects and scale. That they have delivered these earnings in a low growth environment has further cemented their success. Absent substantial regulatory change to break up their monopolies, tech companies will continue to cannibalise their competitors and increase market share. If interest rates stay anchored, multiples are not likely to come under too much pressure.
Even outside of the tech sector, US companies have a good track record of delivering earnings relative to their counterparts in the rest of the world. Since 1995, overall earnings growth in the US has averaged around 16%, compared with 14% in emerging markets, 11% in Europe, 6% in Australia and 3% in the UK. Japanese equities have delivered stronger earnings growth, but that is from an exceptionally low base following the 1990s recession.
The US produces the world’s most successful companies in the world for a variety of reasons. It is an enormous single currency, single language market full of wealthy potential customers. Regulatory and legal structures are amenable to growing a business. It is easier to raise debt and equity finance on Wall Street than anywhere else in the world. The Americans have an entrepreneurial spirit unmatched elsewhere which draws the world’s best and brightest.
If, following the post Covid stimulus induced rebound in global economic growth, the world moderates back to the post Global Financial Crisis experience of persistently low growth and inflation, global investors will continue to be willing to pay a valuation premium for exposure to US companies which can deliver growth in a low growth world.
Portfolio Construction Implications
The obvious portfolio construction implication from the above is a need for flexibility. While we can improve long term expected portfolio returns by having less exposure to US equities – that assumes we cannot actively manage the portfolio, which via the Managed Discretionary Account service, we can. A better return profile could be achieved through being aware of both long-term valuation issues and the shorter-term catalysts which could trigger their realisation. The Managed Discretionary Account service provides the scope to quickly reduce exposure to problematic sectors of the market if the investment environment deteriorates.
While the US market looks unattractive in an absolute sense, there is also considerable dispersion within the market. We can, and do, also hold exposure to equity managers (such as Pan-Tribal and Perpetual Global) with substantial US exposure trading at quite cheap valuation multiples. In conclusion, a good manager, with the flexibility to manage their stock portfolio, can go a long way to improving portfolio outcomes during a market drawdown and it is this type of manager that we are constantly searching for to add into your portfolio.
[1] https://www.drummondcp.com/insights/both-sides-of-the-technology-sector-coin
Disclaimer
Prepared by Drummond Capital Partners (Drummond) ABN 15 622 660 182, a Corporate Authorised Representative of BK Consulting (Aust) Pty Ltd (AFSL 334906). It is exclusively for use for Drummond clients and should not be relied on for any other person. Any advice or information contained in this report is limited to General Advice for Wholesale clients only.
The information, opinions, estimates and forecasts contained are current at the time of this document and are subject to change without prior notification. This information is not considered a recommendation to purchase, sell or hold any financial product. The information in this document does not take account of your objectives, financial situation or needs. Before acting on this information recipients should consider whether it is appropriate to their situation. We recommend obtaining personal financial, legal and taxation advice before making any financial investment decision. To the extent permitted by law, Drummond does not accept responsibility for errors or misstatements of any nature, irrespective of how these may arise, nor will it be liable for any loss or damage suffered as a result of any reliance on the information included in this document. Past performance is not a reliable indicator of future performance.
This report is based on information obtained from sources believed to be reliable, we do not make any representation or warranty that it is accurate, complete or up to date. Any opinions contained herein are reasonably held at the time of completion and are subject to change without notice.